If you’ve always been in awe of folks using the Google Search Console API to do cool things, this article is a good read for you.
You can use BigQuery with the GSC bulk data export to get some of the same benefits without requiring the help of a developer.
With BigQuery, you can efficiently analyze large volumes of data from the GSC bulk data export.
You won’t have real-time data retrieval; that’s available with the API in our scenario but you can rely on daily data imports which means that you are working with up-to-date information.
By leveraging BigQuery and the GSC bulk data export, you can access comprehensive search analytics data – that’s the part you hear everyone raving about on LinkedIn.
According to Gus Pelogia, SEO product manager at Indeed:
“It’s such a game changer and a great opportunity to learn SQL. We can finally bypass GSC and external SEO tools limitations. I was surprised to see how simple it was to retrieve data.”
A Structured Approach To Using BigQuery And Google Search Console (GSC) Data For Content Performance Analysis
The aim of this article is not to provide you with a long list of queries or a massive step-by-step blueprint of how to conduct the most intense audit of all time.
I aim to make you feel more comfortable getting into the groove of analyzing data without the limitations that come with the Google Search Console interface. To do this, you need to consider five steps:
- Identify use cases.
- Identify relevant metrics for each use case.
- Query the data.
- Create a looker studio report to help stakeholders and teams understand your analysis.
- Automate reporting.
The issue we often face when getting started with BigQuery is that we all want to query the data right away. But that’s not enough.
The true value you can bring is by having a structured approach to your data analysis.
1. Identify Use Cases
It is often recommended that you know your data before you figure out what you want to analyze. While this is true, in this case, it will be limiting you.
We recommend you start by determining the specific purpose and goals for analyzing content performance.
Use Case #1: Identify The Queries And Pages That Bring The Most Clicks
“I believe that every high-quality SEO audit should also analyze the site’s visibility and performance in search. Once you identify these areas, you will know what to focus on in your audit recommendations.”
Said Olga Zarr in her “How to audit a site with Google Search Console” guide.
To do that, you want the queries and the pages that bring the most clicks.
Use Case #2: Calculating UQC
If you want to spot weak areas or opportunities, calculating the Unique Query Count (UQC) per page offers valuable insights.
You already know this because you use this type of analysis in SEO tools like Semrush, SE Ranking, Dragon Metrics, or Serpstat (the latter has a great guide on How to Use Google Search Console to Create Content Plans).
However, it is incredibly useful to recreate this with your own Google Search Console data. You can automate and replicate the process on a regular basis.
There are benefits to this:
- It helps identify which pages are attracting a diverse range of search queries and which ones may be more focused on specific topics.
- Pages with a high UQC may present opportunities for further optimization or expansion to capitalize on a wider range of search queries.
- Analyzing the UQC per page can also reveal which position bands (e.g., positions 1-3, 4-10, etc.) display more variability in terms of the number of unique queries. This can help prioritize optimization efforts.
- Understanding how UQC fluctuates throughout the year can inform content planning and optimization strategies to align with seasonal trends and capitalize on peak periods of search activity.
- Comparing UQC trends across different time periods enables you to gauge the effectiveness of content optimization efforts and identify areas for further improvement.
Use case #3: Assessing The Content Risk
Jess Joyce, B2B & SaaS SEO expert has a revenue generating content optimization framework she shares with clients.
One of the critical steps is finding pages that saw a decline in clicks and impressions quarter over quarter. She relies on Search Console data to do so.
Building this query would be great but before we jump into this, we need to assess the content risk.
If you calculate the percentage of total clicks contributed by the top 1% of pages on a website based on the number of clicks each page receives, you can quickly pinpoint if you are in the danger zone – meaning if there are potential risks associated with over-reliance on a small subset of pages.
Here’s why this matters:
- Over-reliance on a small subset of pages can be harmful as it reduces the diversification of traffic across the website, making it vulnerable to fluctuations or declines in traffic to those specific pages.
- Assessing the danger zone: A percentage value over 40% indicates a high reliance on the top 1% of pages for organic traffic, suggesting a potential risk.
- This query provides valuable insight into the distribution of organic traffic across a website.
2. Identify Relevant Metrics
Analyzing your content lets you discern which content is effective and which isn’t, empowering you to make data-informed decisions.
Whether it’s expanding or discontinuing certain content types, leveraging insights from your data enables you to tailor your content strategy to match your audience’s preferences.
Metrics and analysis in content marketing provide the essential data for crafting content that resonates with your audience.
Use Case #1: Identify The Queries And Pages That Bring The Most Clicks
For this use case, you need some pretty straightforward data.
Let’s list it all out here:
- URLs and/or queries.
- Clicks.
- Impressions.
- Search type: we only want web searches, not images or other types.
- Over a specific time interval.
The next step is to determine which table you should get this information from. Remember, as we discussed previously, you have:
- searchdata_site_impression: Contains performance data for your property aggregated by property.
- searchdata_url_impression: Contains performance data for your property aggregated by URL.
In this case, you need the performance data aggregated by URL, so this means using the searchdata_url_impression table.
Use Case #2: Calculating UQC
For this use case, we need to list what we need as well:
- URL: We want to calculate UQC per page.
- Query: We want the queries associated with each URL.
- Search Type: We only want web searches, not images or other types.
- We still need to pick a table, in this case, you need the performance data aggregated by URL so this means using the searchdata_url_impression table.
Use Case #3: Assessing The Content Risk
To calculate the “clicks contribution of top 1% pages by clicks,” you need the following metrics:
- URL: Used to calculate the clicks contribution.
- Clicks: The number of clicks each URL has received.
- Search Type: Indicates the type of search, typically ‘WEB’ for web searches.
- We still need to pick a table, in this case, you need the performance data aggregated by URL so this means using the searchdata_url_impression table. (Narrator voice: notice a trend? We are practicing with one table which enables you to get very familiar with it.)
3. Query The Data
Use Case #1: Identify The Queries And Pages That Bring The Most Clicks
Let’s tie it all together to create a query, shall we?
You want to see pages with the most clicks and impressions. This is a simple code that you can get from Marco Giordano’s BigQuery handbook available via his newsletter.
We have slightly modified it to suit our needs and to ensure you keep costs low.
Copy this query to get the pages with the most clicks and impressions:
SELECT url, SUM(clicks) as total_clicks, SUM(impressions) as total_impressions FROM `pragm-ga4.searchconsole.searchdata_url_impression` WHERE search_type = 'WEB' and url NOT LIKE '%#%' AND data_date = "2024-02-13" GROUP BY url ORDER BY total_clicks DESC;
It relies on one of the most common SQL patterns. It enables you to group by a variable, in our case, URLs. And then, you can select aggregated metrics you want.
In our case, we specified impressions and clicks so we will be summing up clicks and impressions (two columns).
Let’s break down the query Marco shared:
SELECT statement
SELECT url, SUM(clicks) as total_clicks, SUM(impressions) as total_impressions: Specifies the columns to be retrieved in the result set.
- url: Represents the URL of the webpage.
- SUM(clicks) as total_clicks: Calculates the total number of clicks for each URL and assigns it an alias total_clicks.
- SUM(impressions) as total_impressions: Calculates the total number of impressions for each URL and assigns it an alias total_impressions.
FROM clause
- FROM table_name`pragm-ga4.searchconsole.searchdata_url_impression`: Specifies the table from which to retrieve the data.
- table_name: Represents the name of the table containing the relevant data.
- Important to know: replace our table name with your table name.
WHERE clause
- WHERE search_type = ‘WEB’ and url NOT LIKE ‘%#%’: Filters the data based on specific conditions.
- search_type = ‘WEB’: Ensures that only data related to web search results is included.
- url NOT LIKE ‘%#%’: Excludes URLs containing “#” in their address, filtering out anchor links within pages.
- data_date = “2024-02-13”: This condition filters the data to only include records for the date ‘2024-02-13’. It ensures that the analysis focuses solely on data collected on this specific date, allowing for a more granular examination of web activity for that day.
- (Narrator voice: we recommend you select a date to keep costs low.)
Important to know: We recommend you select two days before today’s date to ensure that you have data available.
GROUP BY clause
- GROUP BY url: Groups the results by the URL column.
- This groups the data so that the SUM function calculates total clicks and impressions for each unique URL.
ORDER BY clause
- ORDER BY total_clicks DESC: Specifies the ordering of the result set based on the total_clicks column in descending order.
- This arranges the URLs in the result set based on the total number of clicks, with the URL having the highest number of clicks appearing first.
This query is still more advanced than most beginners would create because it not only retrieves data from the right table but also filters it based on specific conditions (removing anchor links and search types that aren’t exclusively WEB).
After that, it calculates the total number of clicks and impressions for each URL, groups the results by URL, and orders them based on the total number of clicks in descending order.
This is why you should start by your use case first, figuring out metrics second and then writing the query.
Copy this SQL to get the queries in GSC with the most clicks and impressions:
SELECT query, SUM(clicks) as total_clicks, SUM(impressions) as total_impressions FROM `pragm-ga4.searchconsole.searchdata_url_impression` WHERE search_type = 'WEB' AND data_date = "2024-02-13" GROUP BY query ORDER BY total_clicks DESC;
This is the same query, but instead of getting the URL here, we will retrieve the query and aggregate the data based on this field. You can see that in the GROUP BY query portion.
The problem with this query is that you are likely to have a lot of “null” results. These are anonymized queries. You can remove those by using this query:
SELECT query, SUM(clicks) as total_clicks, SUM(impressions) as total_impressions FROM `pragm-ga4.searchconsole.searchdata_url_impression` WHERE search_type = 'WEB' AND is_anonymized_query = false AND data_date = "2024-02-13" GROUP BY Query ORDER BY total_clicks DESC;
Now, let’s go one step further. I like how Iky Tai, SEO at GlobalShares went about it on LinkedIn. First, you need to define what the query does: you can see the high-performing URLs by clicks for a selected date range.
The SQL query has to retrieve the data from the specified table, filter it based on a date range, not a specific date, calculate the total number of impressions and clicks for each URL, group the results by URL, and order them based on the total number of clicks in descending order.
Now that this is done, we can build the SQL query:
SELECT url, SUM(impressions) AS impressions, SUM(clicks) AS clicks FROM `pragm-ga4.searchconsole.searchdata_url_impression` WHERE data_date BETWEEN DATE_SUB(CURRENT_DATE(), INTERVAL 3 DAY) AND DATE_SUB(CURRENT_DATE(), INTERVAL 1 DAY) GROUP BY url ORDER BY clicks DESC;
Before you copy-paste your way to glory, take the time to understand how this is built:
SELECT statement
- SELECT url, SUM(impressions) AS impressions, SUM(clicks) AS clicks: Specifies the columns to be retrieved in the result set.
- url: Represents the URL of the webpage.
- SUM(impressions) AS impressions: Calculates the total number of impressions for each URL.
- SUM(clicks) AS clicks: Calculates the total number of clicks for each URL.
FROM clause
- FROM searchconsole.searchdata_url_impression: Specifies the table from which to retrieve the data.
- (Narrator voice: You will have to replace the name of your table.)
- searchconsole.searchdata_url_impression: Represents the dataset and table containing the search data for individual URLs.
WHERE clause
- WHERE data_date BETWEEN DATE_SUB(CURRENT_DATE(), INTERVAL 3 DAY) AND DATE_SUB(CURRENT_DATE(), INTERVAL 1 DAY): Filters the data based on the date range.
- data_date: Represents the date when the search data was recorded.
- BETWEEN: Specifies the date range from three days ago (INTERVAL 3 DAY) to yesterday (INTERVAL 1 DAY).
- DATE_SUB(CURRENT_DATE(), INTERVAL 3 DAY): Calculates the date three days ago from the current date.
- DATE_SUB(CURRENT_DATE(), INTERVAL 1 DAY): Calculates yesterday’s date from the current date.
Important to know: As we said previously, you may not have data available for the previous two days. This means that you could change that interval to say five and three days instead of three and one day.
GROUP BY clause
GROUP BY url: Groups the results by the URL column.
- This groups the data so that the SUM function calculates impressions and clicks for each unique URL.
ORDER BY clause
ORDER BY clicks DESC: Specifies the ordering of the result set based on the clicks column in descending order.
- This arranges the URLs in the result set based on the total number of clicks, with the URL having the highest number of clicks appearing first.
Important note: when first getting started, I encourage you to use an LLM like Gemini or ChatGPT to help break down queries into chunks you can understand.
Use Case #2: Calculating UQC
Here is another useful Marco’s handbook that we have modified in order to get you seven days of data (a week’s worth):
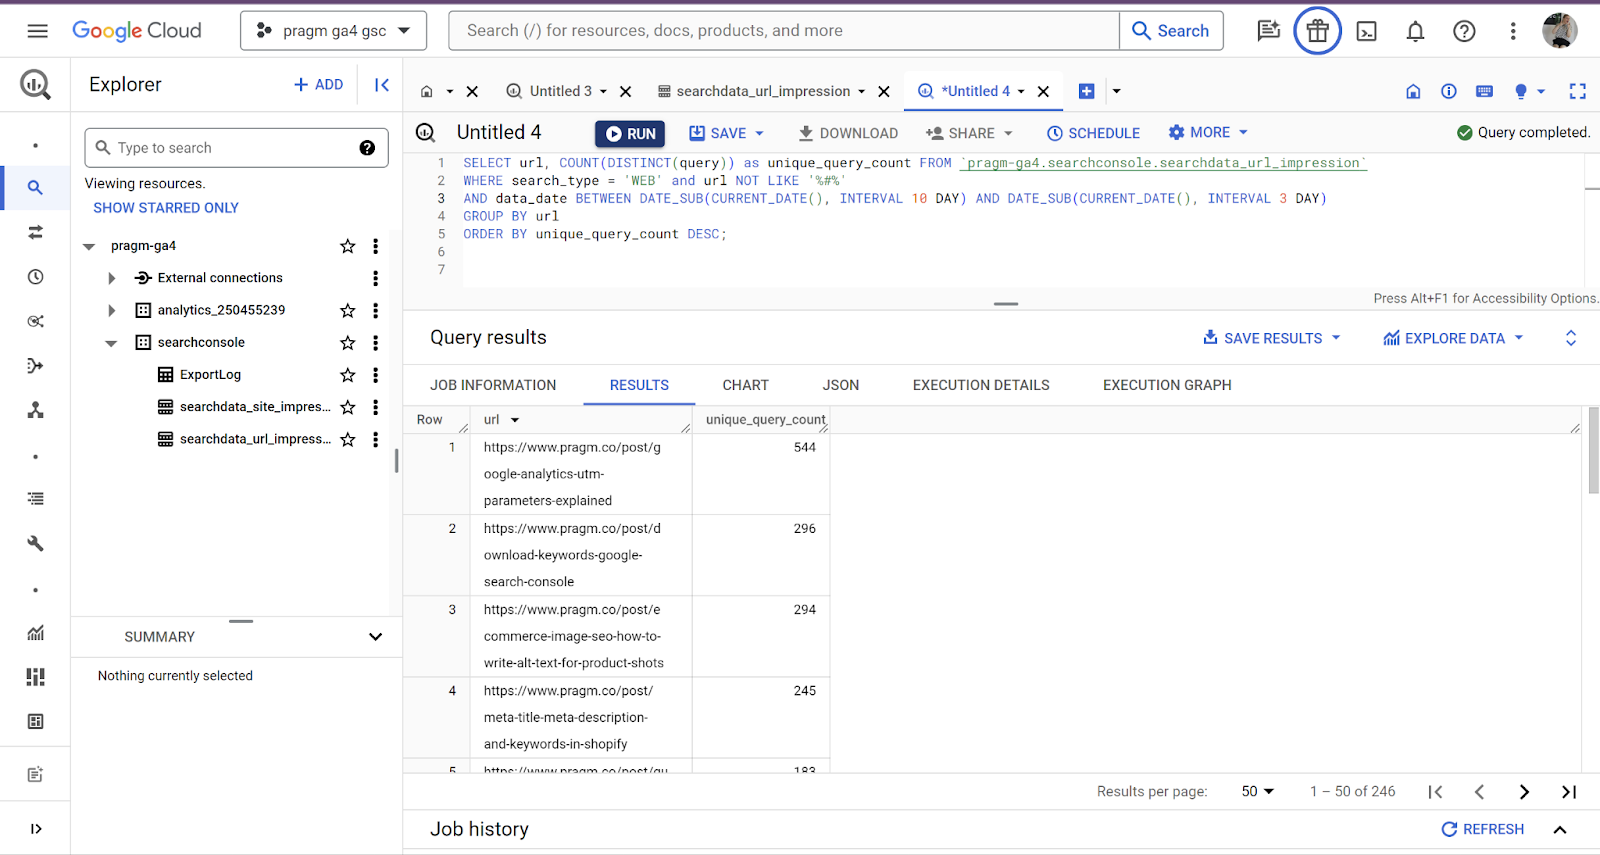
SELECT url, COUNT(DISTINCT(query)) as unique_query_count FROM `pragm-ga4.searchconsole.searchdata_url_impression` WHERE search_type = 'WEB' and url NOT LIKE '%#%' AND data_date BETWEEN DATE_SUB(CURRENT_DATE(), INTERVAL 10 DAY) AND DATE_SUB(CURRENT_DATE(), INTERVAL 3 DAY) GROUP BY url ORDER BY unique_query_count DESC;
 Screenshot from Google Cloud, February 2024
This time, we will not break down the query.
This query calculates the Unique Query Count (UQC) per page by counting the distinct queries associated with each URL, excluding URLs containing ‘#’ and filtering for web searches.
It does that for an interval of seven days while taking into account data may not be available for the two previous days.
The results are then sorted based on the count of unique queries in descending order, providing insights into which pages attract a diverse range of search queries.
Use Case #3: Assessing The Content Risk
This query calculates the percentage of total clicks accounted for by the top 1% of URLs in terms of clicks. This is a far more advanced query than the previous ones. It is taken straight from Marco’s Playbook:
WITH PageClicksRanked AS ( SELECT url, SUM(clicks) AS total_clicks, PERCENT_RANK() OVER (ORDER BY SUM(clicks) DESC) AS percent_rank FROM `pragm-ga4.searchconsole.searchdata_url_impression` WHERE search_type = 'WEB' AND url NOT LIKE '%#%' GROUP BY url ) SELECT ROUND(SUM(CASE WHEN percent_rank <= 0.01 THEN total_clicks ELSE 0 END) / SUM(total_clicks) * 100, 2) AS percentage_of_clicks FROM PageClicksRanked;
This SQL query is more complex because it incorporates advanced techniques like window functions, conditional aggregation, and common table expressions.
Let’s break it down:
Common Table Expression (CTE) – PageClicksRanked
- This part of the query creates a temporary result set named PageClicksRanked.
- It calculates the total number of clicks for each URL and assigns a percentile rank to each URL based on the total number of clicks. The percentile rank is calculated using the PERCENT_RANK() window function, which assigns a relative rank to each row within a partition of the result set.
- Columns selected:
- url: The URL from which the clicks originated.
- SUM(clicks) AS total_clicks: The total number of clicks for each URL.
- PERCENT_RANK() OVER (ORDER BY SUM(clicks) DESC) AS percent_rank: Calculates the percentile rank for each URL based on the total number of clicks, ordered in descending order.
Conditions
- search_type = ‘WEB’: Filters the data to include only web search results.
- AND url NOT LIKE ‘%#%’: Excludes URLs containing “#” from the result set.
Grouping
- GROUP BY url: Groups the data by URL to calculate the total clicks for each URL.
Main Query
- This part of the query calculates the percentage of total clicks accounted for by the top 1% of URLs in terms of clicks.
- It sums up the total clicks for URLs whose percentile rank is less than or equal to 0.01 (top 1%) and divides it by the total sum of clicks across all URLs. Then, it multiplies the result by 100 to get the percentage.
Columns selected
- ROUND(SUM(CASE WHEN percent_rank <= 0.01 THEN total_clicks ELSE 0 END) / SUM(total_clicks) * 100, 2) AS percentage_of_clicks: Calculates the percentage of clicks accounted for by the top 1% of URLs. The CASE statement filters out the URLs with a percentile rank less than or equal to 0.01, and then it sums up the total clicks for those URLs. Finally, it divides this sum by the total sum of clicks across all URLs and multiplies it by 100 to get the percentage. The ROUND function is used to round the result to two decimal places.
Source
- FROM PageClicksRanked: Uses the PageClicksRanked CTE as the data source for calculations.
(Narrator voice: this is why we don’t share more complex queries immediately. Writing complex queries immediately requires knowledge, practice, and understanding of the underlying data and business requirements.)
In order to write such queries, you need:
- A solid understanding of SQL syntax: SELECT statements, GROUP BY, aggregate functions, subqueries and window functions to start.
- A deep understanding of the database schema which is why we took the time to go through them in another article.
- Practice! Writing and optimizing SQL queries does the trick. So does working on datasets and solving analytical problems! Practice means taking an iterative approach to experiment, test and refine queries.
- Having a good cookbook: Setting aside good queries you can tweak and rely on.
- Problem-solving skills: To find the right approach, you have to be able to break down complex analytical tasks into manageable steps. That’s why we started with the five-step framework.
- A performance mindset: You want to improve query performance, especially for complex queries operating on large datasets. If you don’t, you could end up spending a lot of money in BigQuery.
4. Create Looker Studio Dashboards
Once this is done, you can use Looker Studio to build dashboards and visualizations that showcase your content performance metrics.
You can customize these dashboards to present data in a meaningful way for different stakeholders and teams. This means you aren’t the only one accessing the information.
We will dive into this portion of the framework in another article.
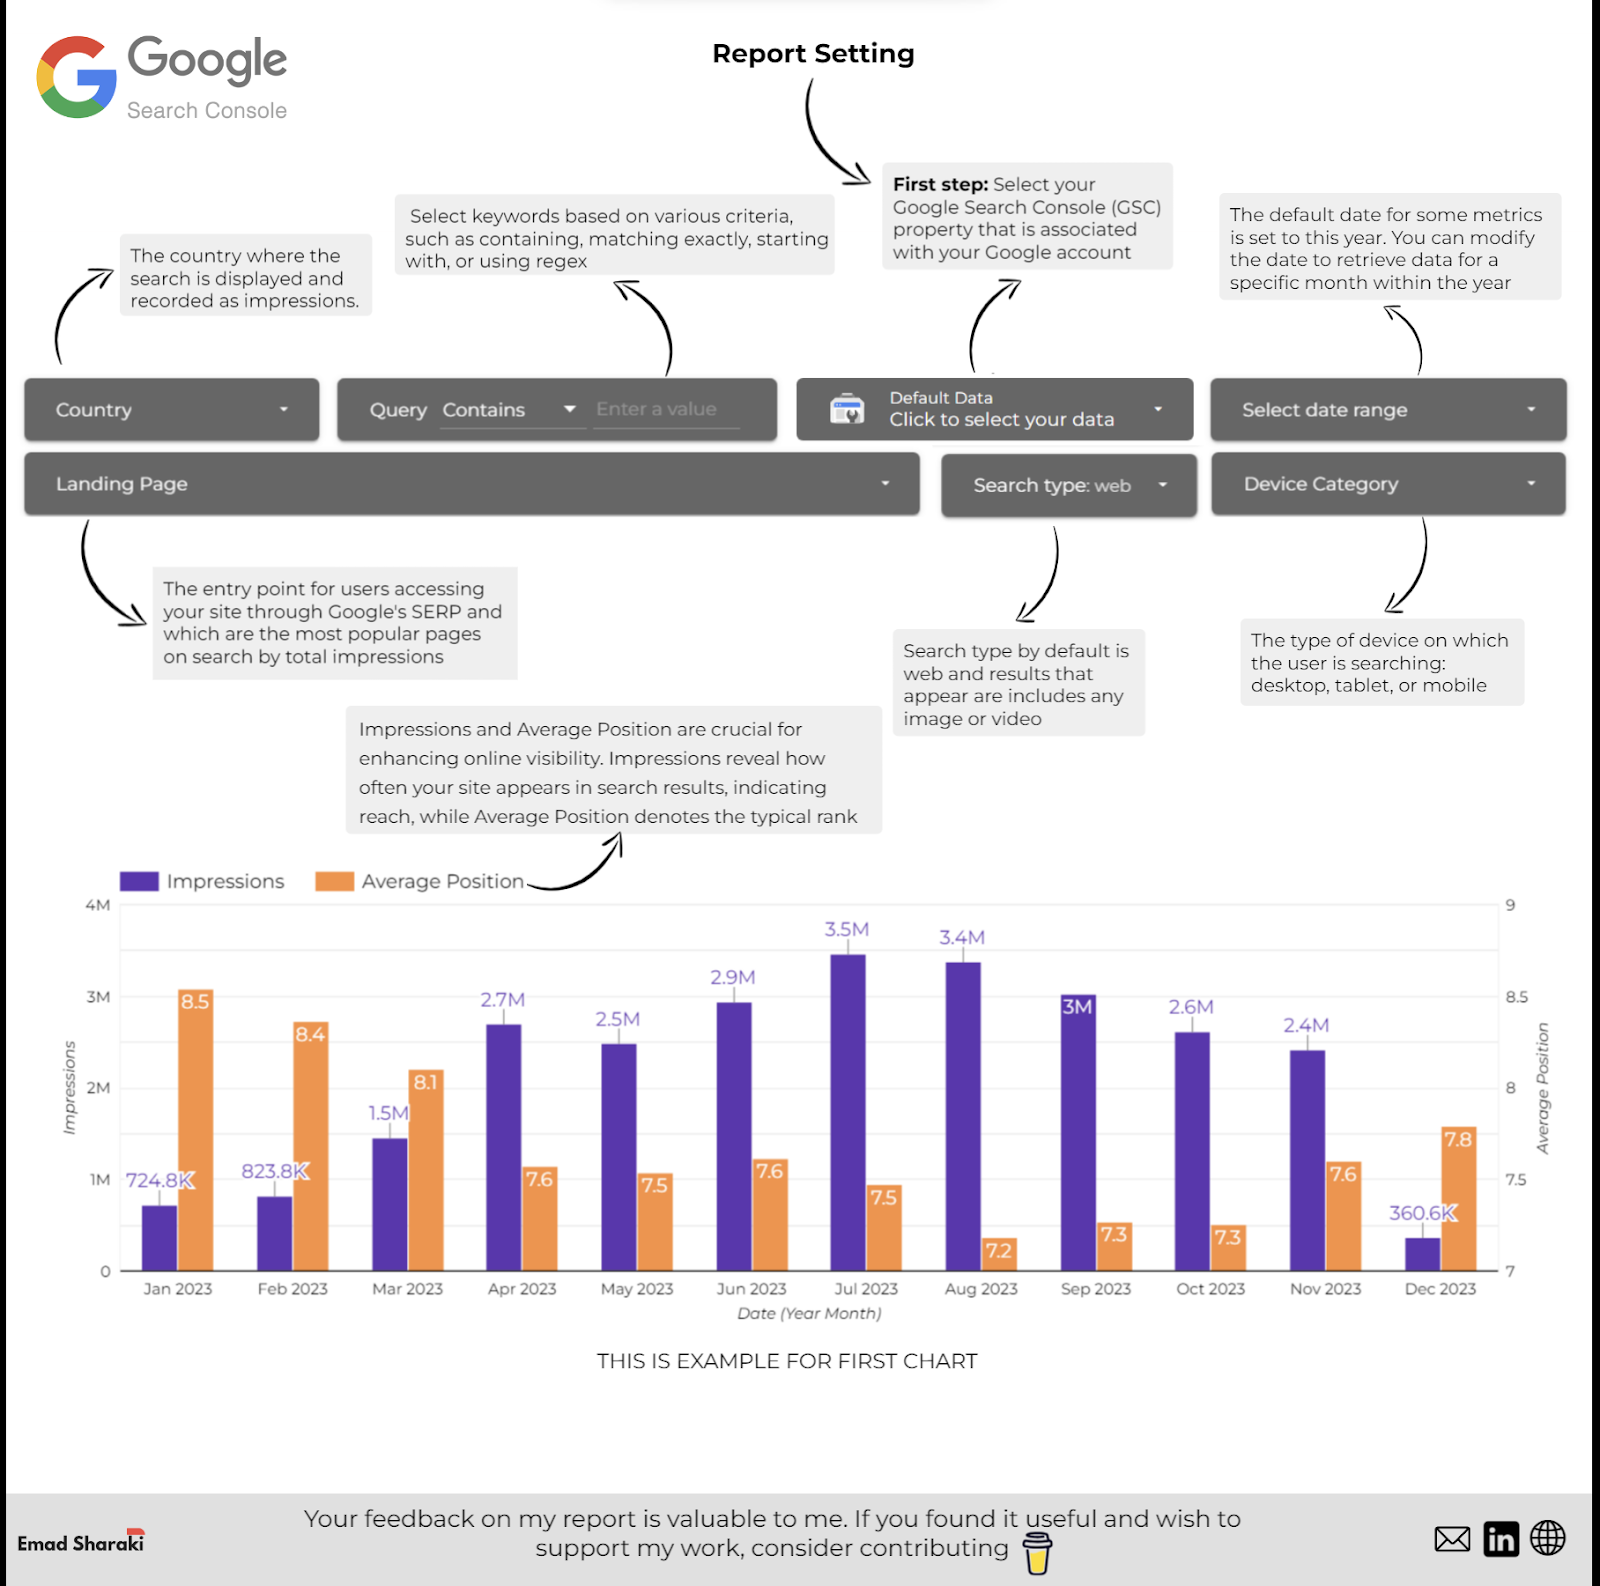
However, if you want to get started with a Looker Studio dashboard using BigQuery data, Emad Sharaki shared his awesome dashboard. We recommend you give it a try.
 Image from Emad Sharaki, February 2024
5. Automate Reporting
Once you have done all this, you can set up scheduled queries in BigQuery to automatically fetch GSC data present in the tables at regular intervals.
This means you can automate the generation and distribution of reports within your company.
You can check out the official documentation for this portion for now. We will cover this at a later date in another dedicated article.
The one tip we will share here is that you should schedule queries after the typical export window to ensure you’re querying the most recent available data.
In order to monitor the data freshness, you should track export completion times in BigQuery’s export log.
You can use the reporting automation to enable other teams when it comes to content creation and optimization. Gianna Brachetti-Truskawa, SEO PM and strategist, supports editorial teams by integrating reports directly into the CMS.
This means editors can filter existing articles by performance and prioritize their optimization efforts accordingly. Another automation reporting element to consider is to integrate with Jira to connect your performance to a dashboard with custom rules.
This means that articles can be pulled to the top of the backlog and that seasonal topics can be added to the backlog in a timely manner to create momentum.
Going Further
Obviously, you will need more use cases and a deeper understanding of the type of content audit you want to conduct.
However, the framework we shared in this article is a great way to ensure things stay structured. If you want to take it further, Lazarina Stoy, SEO data expert, has a few tips for you:
“When doing content performance analysis, it’s important to understand that not all content is created equal. Utilize SQL Case/When statements to create subsets of the content based on page type (company page, blog post, case study, etc.), content structure patterns (concept explainer, news item, tutorial, guide, etc), title patterns, target intent, target audiences, content clusters, and any other type of classification that is unique to your content.
That way you can monitor and troubleshoot if you detect patterns that are underperforming, as well as amplify the efforts that are paying off, whenever such are detected.”
If you create queries based on these considerations, share them with us so we can add them to the cookbook of queries one can use for content performance analysis!
Conclusion
By following this structured approach, you can effectively leverage BigQuery and GSC data to analyze and optimize your content performance while automating reporting to keep stakeholders informed.
Remember, collecting everyone else’s queries will not make you an overnight BigQuery pro. Your value lies in figuring out use cases.
After that, you can figure out the metrics you need and tweak the queries others created or write your own. Once you have that in the bag, it’s time to be a professional by allowing others to use the dashboard you created to visualize your findings.
Your peace of mind will come once you automate some of these actions and develop your skills and queries even more!
More resources:
Featured Image: Suvit Topaiboon/Shutterstock
