Google Ads is rolling out three new columns to reports that make it easier to understand how conversions impact campaign performance.
The three new columns include the following:
- Results
- Results value
- Conversion goals
Before this update, you would have had to apply custom segments to see each conversion action and the categories they fall under. Now the data is more readily available.
Here’s more about the new columns in Google Ads reports.
Results Column
 Screenshot from: support.google.com/google-ads/answer/12849470, October 2022.
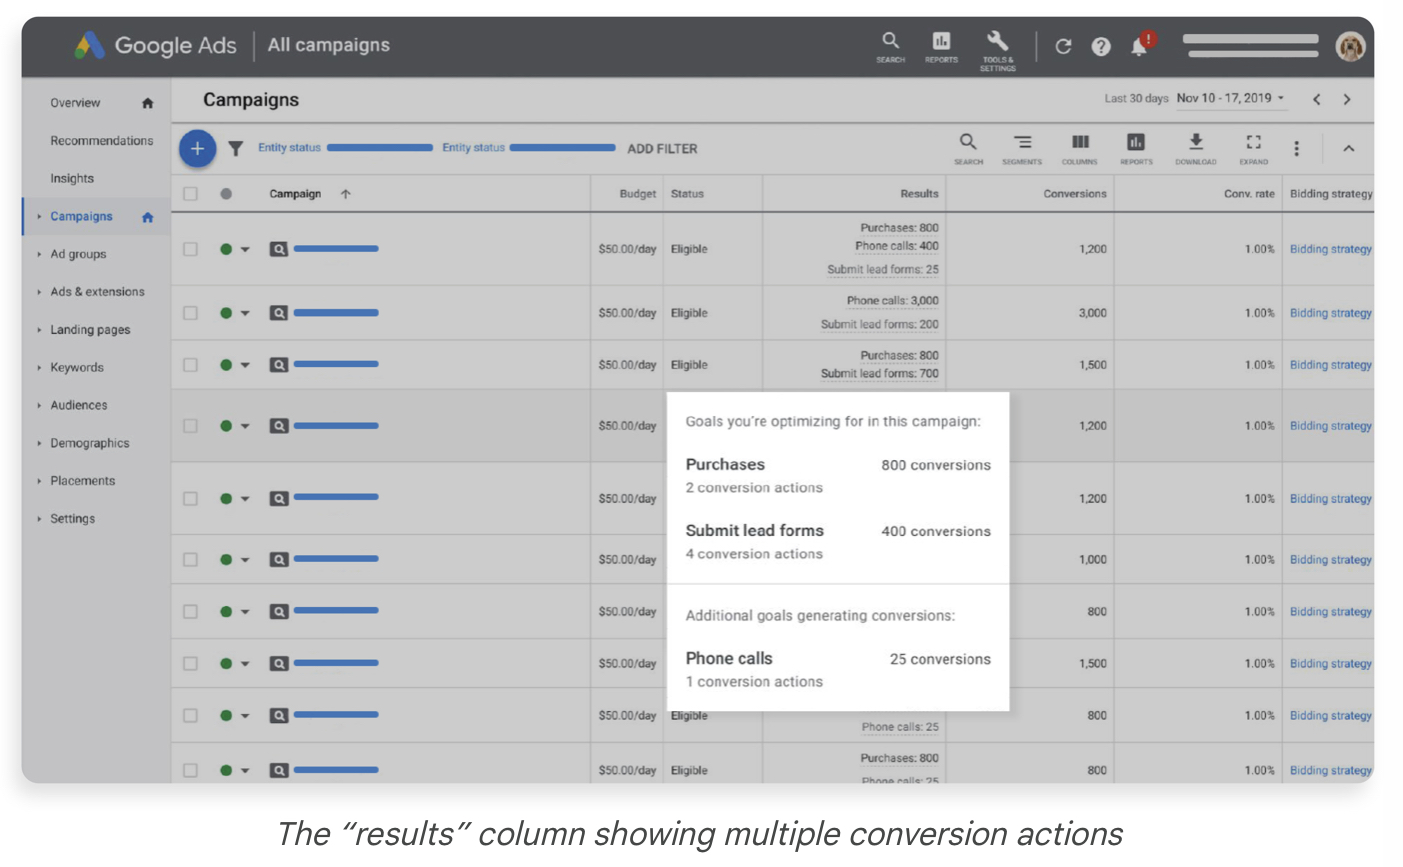
The results column shows the number of conversions received across your primary conversion actions for each of the standard goals in your account.
This column will also show you the impact a campaign is driving against goals it’s not optimizing towards. The example above shows how the campaign generates phone calls, even though it’s not optimized for that type of conversion.
Results Value
 Screenshot from: support.google.com/google-ads/answer/12849470, October 2022.
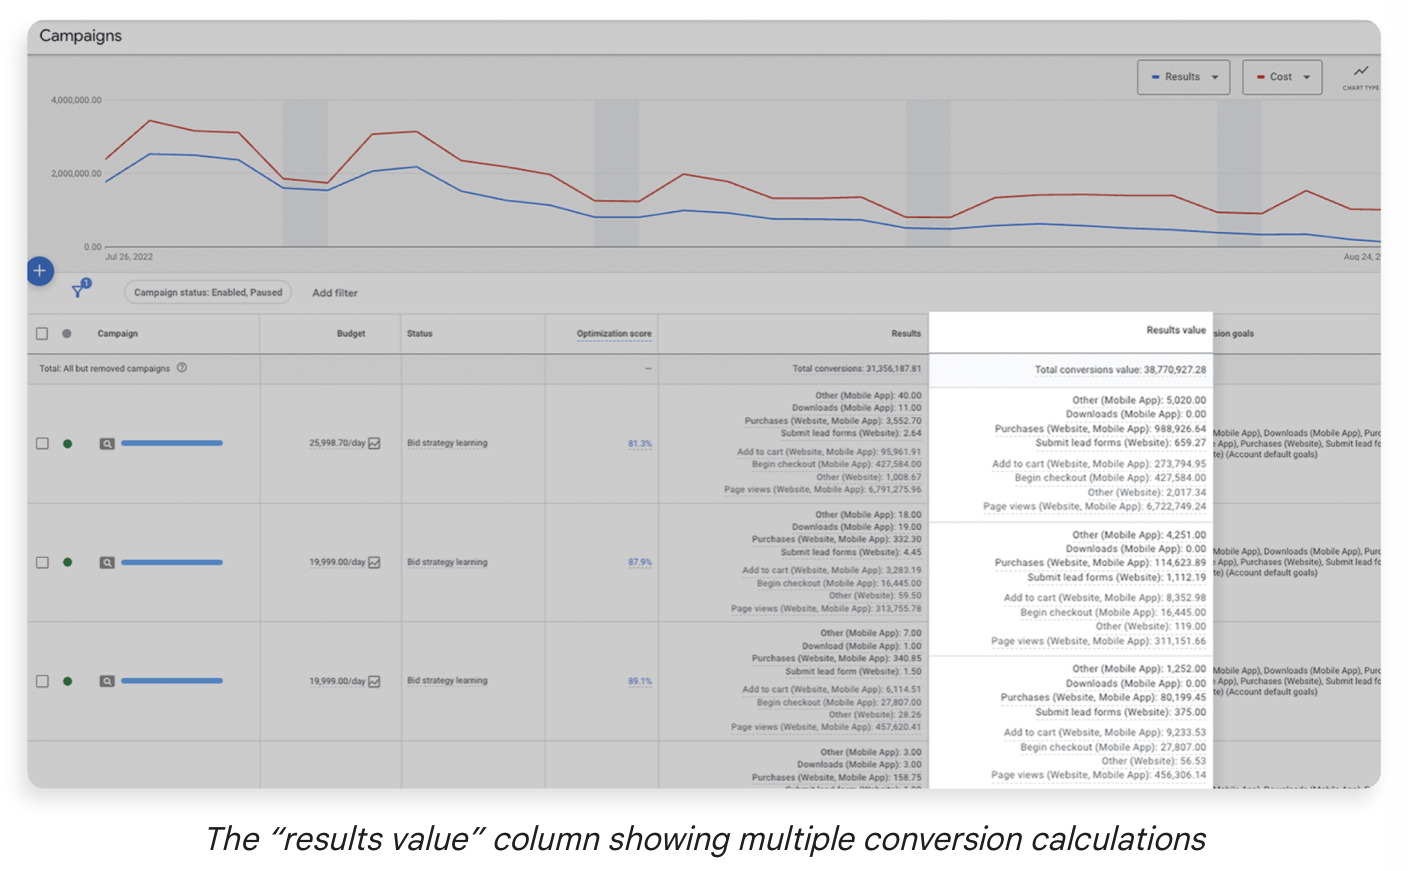
The results value column shows the calculated conversion values you’ve received across your primary conversion actions for each of the standard goals in your account.
The example above shows how easy it is to compare and contrast the total conversions versus the total value generated.
Conversion Goals Column
 Screenshot from: support.google.com/google-ads/answer/12849470, October 2022.
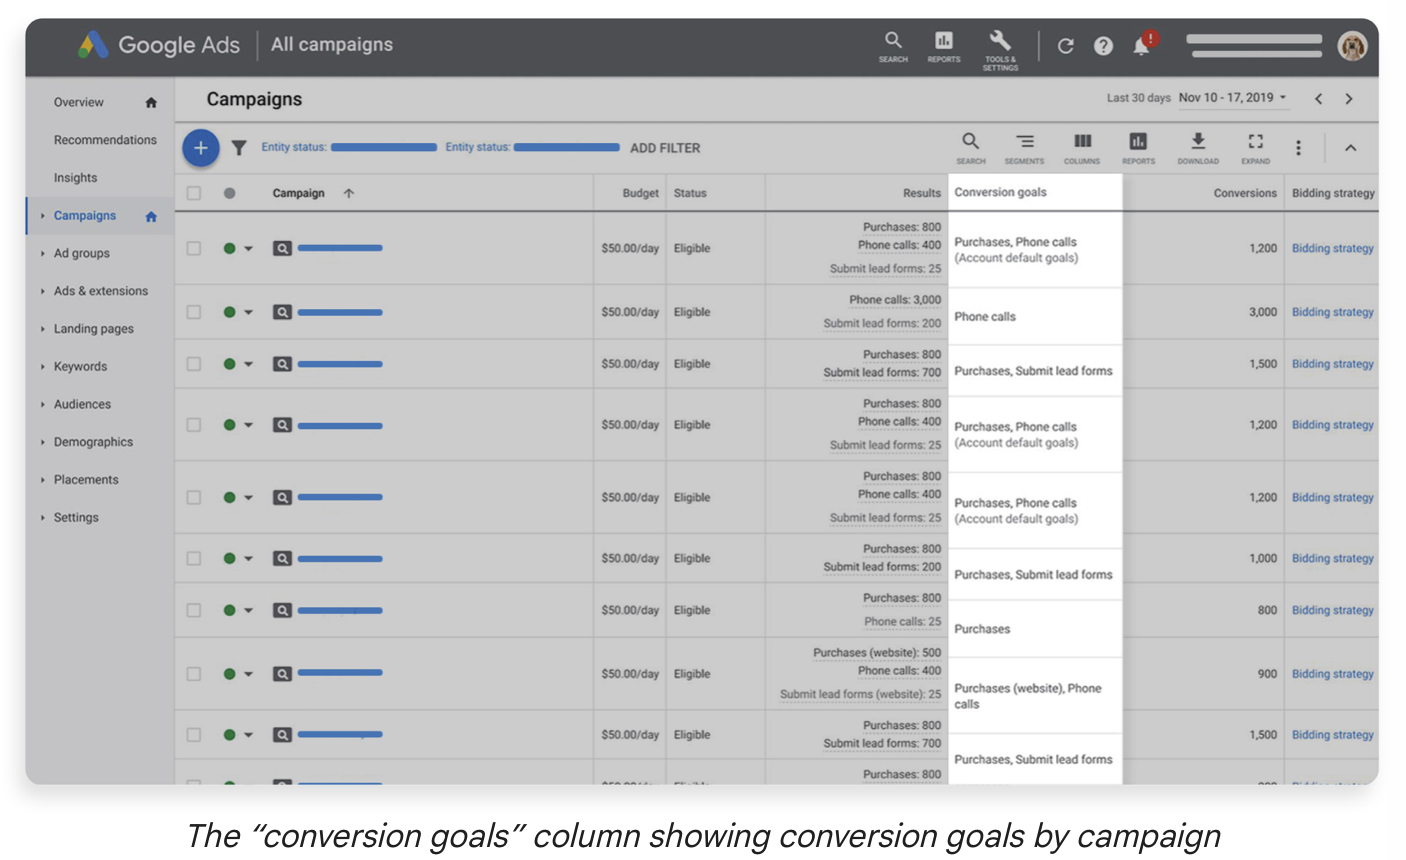
The conversion goals column shows you the goals listed in your campaign-level settings that drive performance.
If you want to analyze campaigns optimized for lead form submissions, you can easily see which ones you need to look at.
Availability
The three new columns in Google Ads are available on the Campaigns page for tables and charts and in custom reporting pages like the Report Editor or Custom dashboards. You’ll also be able to access this data at the manager account level.
Source: Google
Featured Image: Tada Images/Shutterstock
