As an SEO pro, you’ve probably struggled to prove how your efforts impact bottom-line business metrics like customers & revenue.
It’s easy to install Google Analytics and see how many visitors you are getting from organic search, and if you set up Goal Tracking on form submissions, you can even measure the number of leads.
But it’s historically been much harder to get that same attribution data into your CRM and report on metrics like how many new sales opportunities were generated from SEO, how much pipeline, the number of new customers, etc.
Fortunately, we can offer a solution.
Continue reading to learn how you can attribute leads & customers to SEO in your company’s CRM and run reports to prove the value your SEO efforts are generating (and hopefully secure some more budget).
Why You Should Track SEO Efforts With A CRM
Imagine you do SEO for a project management software company.
To generate leads, you do SEO and use paid advertising through Google, Facebook, and similar platforms.
If you were just using Google Analytics to measure visitors and goals, your analytics data would look similar to this:
| SEO | Facebook Ads | Google Ads | |
| Spend | $5,000 | $5,000 | $5,000 |
| Visitors | 200 | 500 | 400 |
| Goals in Google Analytics (Leads) | 30 | 40 | 40 |
If this were your only source of insights – website visitors and leads – then your Facebook Ads and Google Ads would appear to outperform your SEO efforts.
With that data, you might spend most of your marketing budget on paid channels.
But what if you could see the complete picture of the number of customers and revenue generated? Your data might look similar to this:
| SEO | Facebook Ads | Google Ads | |
| Spend | $5,000 | $5,000 | $5,000 |
| Visitors | 200 | 500 | 400 |
| Leads | 30> | 40 | 40 |
| Customers | 25 | 7 | 12 |
| Revenue | $45,000 | $8,000 | $18,000 |
Looking at the numbers above, you can see that your SEO efforts are far outperforming your paid ads because:
- You acquired more customers from SEO (25) than Google Ads and Facebook Ads combined (19).
- The conversion rate from lead to a customer is greater for SEO (83%) than for Google Ads and Facebook Ads combined (17.5% for Facebook Ads and 30% for Google Ads).
- The average customer value is greater for SEO at $1,800 per customer than for Google Ads ($1,500) and for Facebook Ads ($1,142).
- The customer acquisition cost is lower for SEO at $200 than for Google Ads ($416) and for Facebook Ads ($714).
When you track the performance of your marketing campaigns based on the number of customers acquired and revenue generated, you will see the full picture of how they perform and be able to allocate your resources accordingly.
In this case, you’d be able to make a great business case for how important SEO is to the business and could potentially win more budget and resources to help grow.
How To Track Customers & Revenue From SEO With A CRM
Now that you understand the importance of tracking customers & revenue from SEO let’s look at how to do it.
It boils down to two steps: Ensuring you have the required data in your CRM and running the right reports.
1. Check The Data
Ensure you have attribution data on each of your leads & customers inside your CRM (i.e., the source channel, campaign, ad group, etc.).
Most CRM systems have custom fields that store contact information and sales opportunities, but do they also track how the customers discovered your business in the first place?
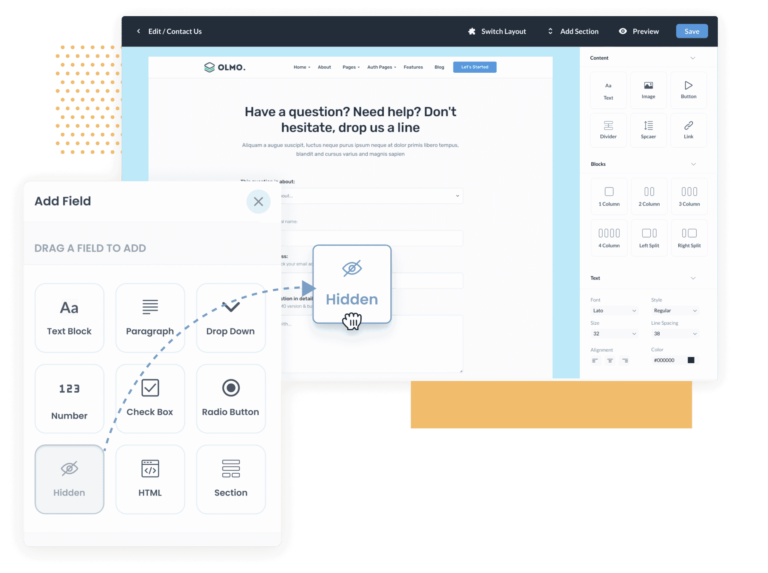
The easiest way to do this is by adding hidden fields to the lead generation forms on your website and then writing the attribution information into those fields.
That way, the data is captured alongside the lead’s name, email address, phone number, etc., and can be sent straight into your CRM.
Most popular form-building tools have the ability to add hidden fields to forms and make it easy to drag and drop them in.
-
 Screenshot by author, December 2022
Once you’ve added the hidden fields to the forms, you can use tools like Attributer.io (Disclosure: I am the founder of Attributer) to figure out where each lead has come from and write the data into the hidden fields where it will be sent to your CRM with each form submission.
2. Run Reports With CRM Or Analytics Tools
Now that you have the correct attribution information for each customer in your CRM, you can use it to run reports.
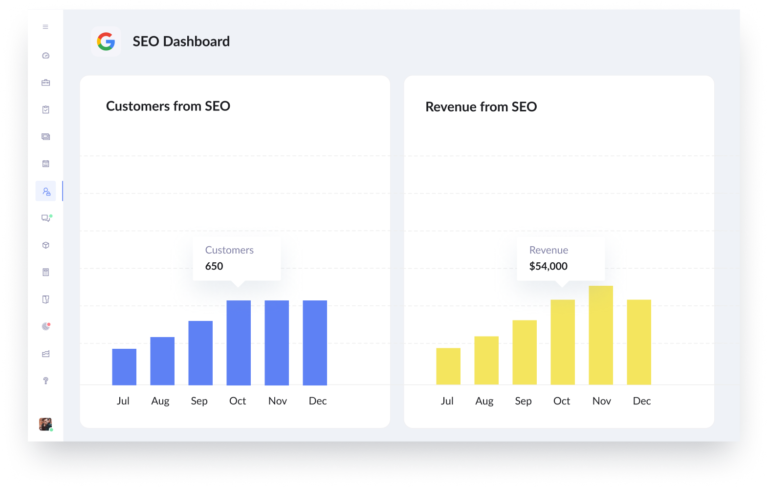
The quickest and easiest way to do this is to use your CRM’s built-in reporting tools.
Depending on how advanced they are, you should be able to report on metrics like the number of leads from SEO, the number of sales opportunities, the number of customers, the amount of revenue generated, etc.
-
 Screenshot by author, December 2022
Alternatively, if you’re looking for more advanced analytics, you can export the data to a spreadsheet or connect your CRM to third-party analytics tools like Microsoft Power BI, Tableau, or Looker Studio (formerly Google Data Studio).
This would allow you to run more advanced reports that could answer questions like:
- How many leads do we get from our SEO efforts on our product pages?
- Which search engines are generating the most customers?
- Which individual blog posts are generating the most leads?
- How many customers do we get from our content hub pages?
Five Metrics SEO Professionals Should Track
Now that you understand how to get the attribution data into your CRM and run reports, here are some ideas for reports you should look at to help prove the value of your SEO efforts.
The Number Of Leads From SEO Vs. Other Channels
-
 Screenshot by author, December 2022
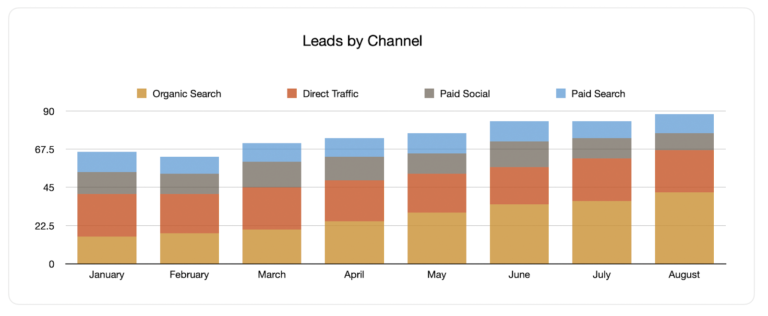
The example graph above shows how many leads were generated via the different marketing channels.
As you can see, this report demonstrates the value SEO is providing in that it is generating more leads for the business than paid channels like Google Ads and Facebook Ads.
Number Of Customers From SEO Vs. Other Channels
-
 Screenshot by author, December 2022
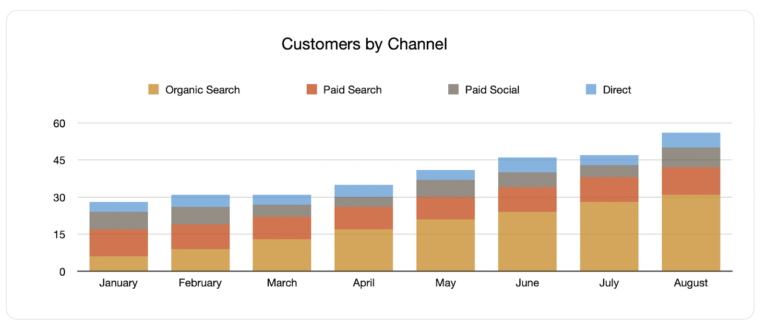
The example graph above shows how many customers have been generated from the different marketing channels.
Not only does this show that SEO is driving the majority of customers for the business, but it can also be useful for calculating the conversion rate of leads to customers.
It’s quite common for leads from organic search to convert much better down the funnel than from sources like Facebook Ads, as these leads often have the problem your product/service solves and are actively looking to purchase.
Revenue From SEO By Landing Page Group
-
 Screenshot by author, December 2022
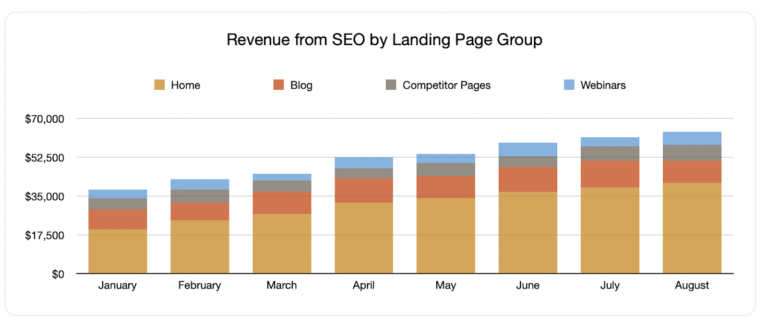
The example graph above shows the amount of revenue generated from customers who have come from your SEO efforts, broken down by the landing page group (i.e., the grouping of pages based on the subfolder in the URL.
This report allows you to see what types of content are generating customers & revenue from search engines and can help you identify what you need to create more.
Similarly, if you see a change in the amounts of customers & revenue coming from SEO, this report can help you identify what happened. Was it that the homepage saw a boost in rankings?
Or is it that the blog posts and webinars you’ve been diligently creating are starting to get traction?
Average Deal Size From SEO Vs. Other Channels
-
 Screenshot by author, December 2022
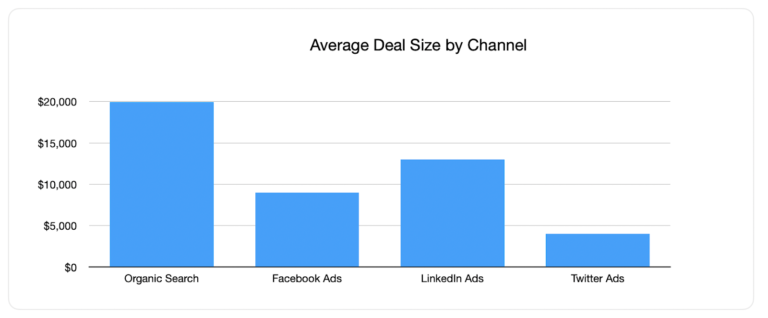
The example graph shows the average deal size of customers that came through SEO versus those from other channels.
This, combined with the number of customers that came from SEO and the conversion rates, can be useful in modeling potential budget increases.
You could create a spreadsheet model that shows the increase in the number of visitors you’d get from more budget, and then using the conversion rates and average deal size, model it through the funnel to show the revenue increase you would expect to get from these changes.
Being able to show expected growth in revenue is a lot more convincing than showing the expected change in visitors, particularly to financial controllers who think in dollars and cents rather than impressions, clicks, and visitors.
Time To Close From SEO Vs. Other Channels
-
 Screenshot by author, December 2022
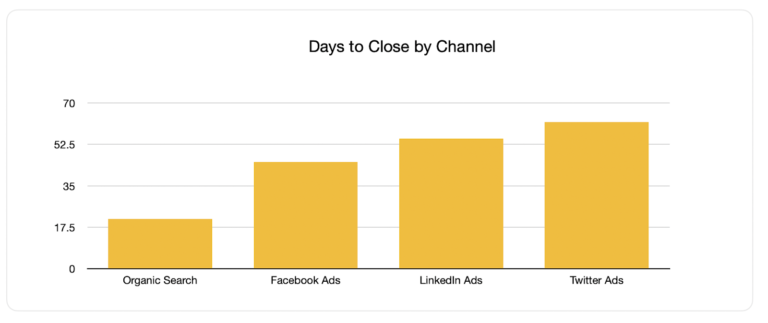
The example graph shows the average time to close for customers that came through SEO versus customers from other channels.
This can be useful in several ways.
Firstly, it’s quite common that sales opportunities from SEO will close faster than those from channels like Facebook Ads because leads from SEO tend to be in purchase mode.
This can be a good data point to convince management of the value of SEO.
Similarly, if you are modeling out how potential budget increases in SEO will impact bottom-line numbers like customers and revenue, you can use this time to close metrics to understand when the changes you are advocating will start to have an impact on revenue.
This can help ensure your model doesn’t show revenue increases too early and can help prevent finance teams from retracting the budget if the numbers aren’t met.
Wrap Up
If you’ve probably struggled in the past to report on how your SEO efforts are impacting key business metrics like customers & revenue, then you’ve probably felt the pain of not being able to show the true value of SEO.
However, if you can start tracking the source of every one of your leads in your organization’s CRM, then not only would you be able to show exactly how many customers and how much revenue SEO is generating, but you’d then be able to accurately model out how budget increases or strategy changes will drive bottom-line growth.
And if you can show how much revenue you think these changes are going to make, then you’re much more likely to get that extra budget approved!
More resources:
Featured Image: 3rdtimeluckystudio/Shutterstock
